


Prometheus Metrics
Prometheus metrics
XMQ can expose its counters to Prometheus on a listener of its own. It is off unless enabled, because a new listening port is not something a broker should open without being asked. The endpoint answers one path, GET /metrics, in the Prometheus text exposition format; everything else is a 404.
It is a listener rather than a path on the configuration interface: a scrape carries no administrator session, and the scraper is often a process that has no business reaching the interface at all. The figures come from the same counters the Dashboard shows, so the exporter adds no work to the delivery path.
Enabling it
Open Configuration → Prometheus, tick Enabled, set the bind address and port, and press Save. The listener is replaced at once: no broker restart, and no MQTT client is disconnected. The same section can be written inxmq_server.conf when the interface is not available:
"prometheus": {
  "enabled": true,
  "bind_ip": "0.0.0.0",
  "port": 9184,
  "username": "",
  "password": ""
}| Key | Meaning | Default |
|---|---|---|
enabled | Whether the listener is created. | false |
bind_ip | Address to accept scrapes on. | 0.0.0.0 |
port | Port to accept scrapes on, above 1024. | 9184 |
username | HTTP Basic username; empty means no authentication. | empty |
password | HTTP Basic password, stored as a verifier; at least 8 characters. | empty |
The port must not be one of the MQTT, MQTT+SSL or web interface ports: the broker refuses it with a sentence naming the other user. If another process already holds the address and port, the endpoint does not start and the interface says why; the broker itself keeps running.
Scraping it
scrape_configs:
  - job_name: xmq
    metrics_path: /metrics
    static_configs:
      - targets: ["broker-1:9184", "broker-2:9184"]
    # Only when the endpoint has a username and password.
    basic_auth:
      username: metrics
      password: "the same secret entered on the Prometheus page"
The endpoint is per node. A cluster of three nodes answers three series sets, each labelled by node in xmq_build_info; aggregate in the query, not in the broker. The listener lives for the whole process, not for the MQTT server, so a scrape during a stop still answers: xmq_up is 0and the broker counters are absent rather than stale.
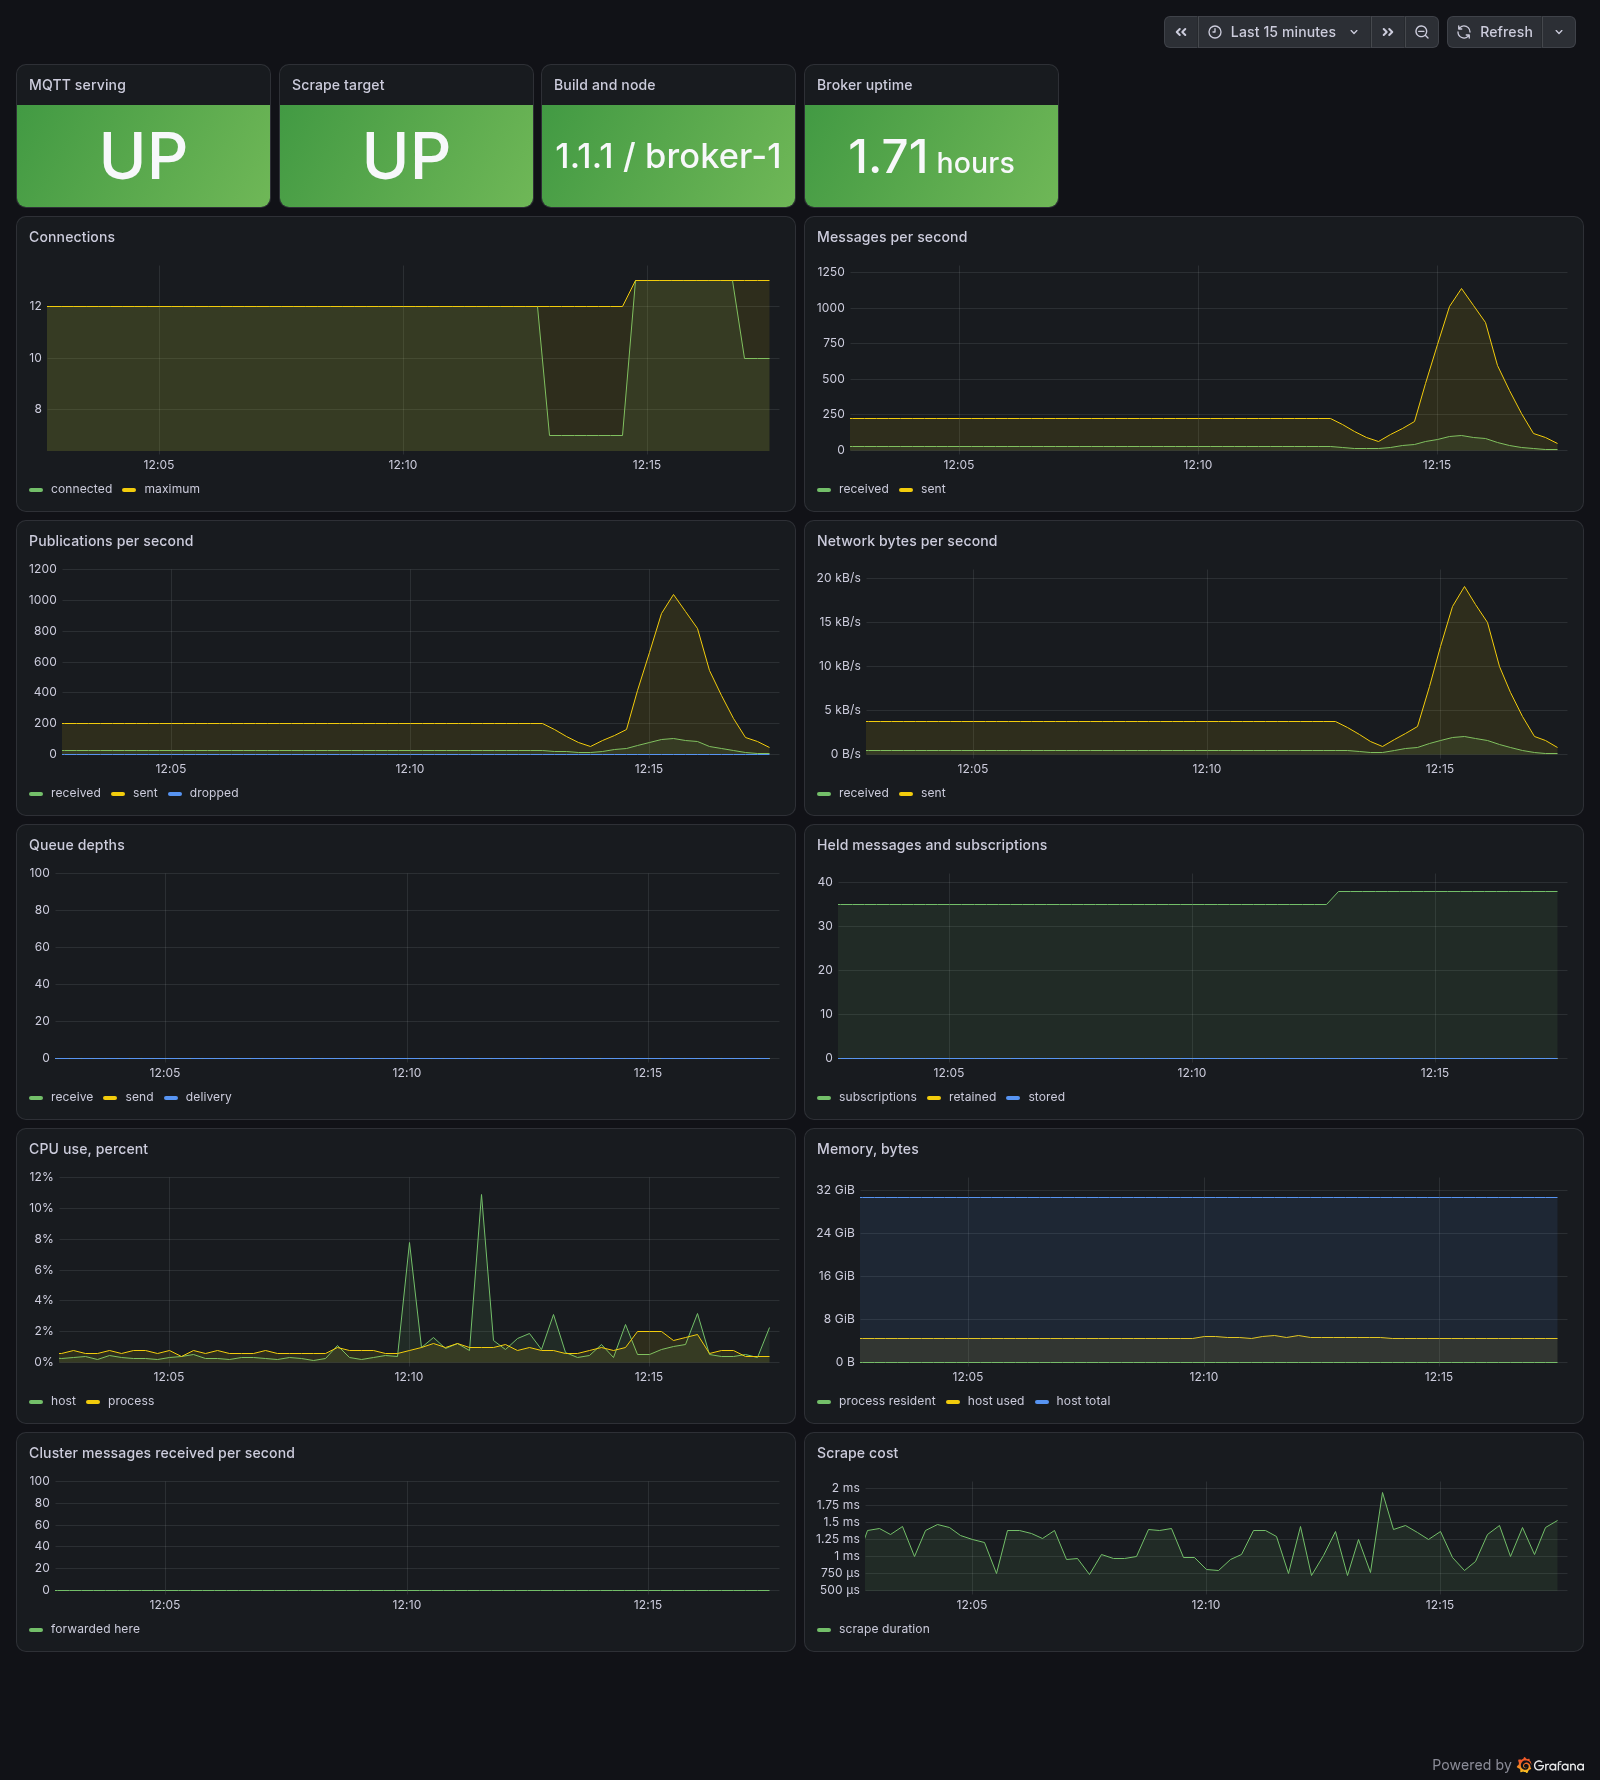
A ready Prometheus, Loki and Grafana stack, with dashboards and alert rules, is indocker/observability of the XMQ repository. It needs an XMQ image with this endpoint (1.1.1 or later). The dashboards import into a Grafana you already run as they are; its README says which data source UID each panel asks for.
Health probes
The same listener answers two endpoints that need no credentials, for a load balancer or a Kubernetes probe:
curl -i http://broker-1:9184/healthz   # 200 {"status":"ok"} while the process is alive
curl -i http://broker-1:9184/readyz    # 200 ready, 503 not ready with a reason
/healthz says only that the process is alive. /readyz is503 while MQTT is stopped or starting, and on a cluster node that does not hold its lease - the same condition under which the node refuses clients. The body carries a short reason. Neither probe reveals configuration or counters, which is why they are not behind the Basic authentication that protects/metrics.
Authentication and exposure
With no username the endpoint is open, which is the default and suits a scraper on a private address. With a username and password every scrape must carry HTTP Basic credentials; a request without them, or with the wrong ones, is answered with401 Unauthorized and a WWW-Authenticate: Basic challenge. There is no anonymous fallback once a username is set, and a username without a stored password is refused rather than opened.
The password is kept as a one-way PBKDF2 verifier, never as text, and is never sent back to the page - a password that is set reads as *****, and sending that mask back unchanged keeps it. To remove authentication, clear the username.
The listener is not encrypted. Basic credentials travel with every scrape, so use a private network or put a TLS proxy in front of it. There is one credential pair per endpoint, not one per scraper, and no per-metric filtering.
What is exported
xmq_up is 1 while MQTT is running and 0 while it is stopped or starting. It is not Prometheus's own up: that one is created by Prometheus per target and says whether the scrape arrived, whilexmq_up says whether the broker behind it is serving.
| Metric | Type | Meaning |
|---|---|---|
xmq_build_info | gauge | Version and node name, as labels. |
xmq_up | gauge | Whether MQTT is being served. |
xmq_broker_clients_connected | gauge | Clients connected now. |
xmq_broker_clients_maximum | gauge | Most clients connected at one time. |
xmq_broker_clients_total | counter | Clients that have connected since the start. |
xmq_broker_clients_disconnected_total | counter | Clients that have disconnected since the start. |
xmq_broker_messages_received_total | counter | MQTT messages received. |
xmq_broker_messages_sent_total | counter | MQTT messages sent. |
xmq_broker_publish_received_total | counter | PUBLISH messages received. |
xmq_broker_publish_sent_total | counter | PUBLISH messages sent. |
xmq_broker_publish_dropped_total | counter | PUBLISH dropped because a session queue was full. |
xmq_broker_retained_messages | gauge | Retained messages held. |
xmq_broker_stored_messages | gauge | Messages held for later delivery. |
xmq_broker_bytes_received_total | counter | Bytes received from clients. |
xmq_broker_bytes_sent_total | counter | Bytes sent to clients. |
xmq_broker_subscriptions | gauge | Subscriptions held. |
xmq_broker_cluster_messages_received_total | counter | Publications received from other cluster nodes. |
xmq_broker_queue_receive | gauge | Messages waiting in the receive queues. |
xmq_broker_queue_send | gauge | Messages waiting in the send queues. |
xmq_broker_queue_delivery | gauge | Messages waiting in the delivery queues. |
xmq_broker_write_capacity_pauses_total | counter | Times publishers were paused because persistent writes reached max_queued_writes. |
xmq_broker_write_capacity_paused_sessions | gauge | Publisher sessions currently paused while Redis writes catch up. |
xmq_cluster_enabled | gauge | Whether cluster mode is enabled on this node. |
xmq_cluster_nodes | gauge | Registered nodes in the cluster. |
xmq_cluster_connected_peers | gauge | Peers with at least one open link to this node. |
xmq_cluster_links | gauge | Total open outgoing links from this node to its peers. |
xmq_broker_uptime_seconds | gauge | Seconds since the broker started serving. |
xmq_host_cpu_percent | gauge | Whole-machine CPU use, percent of all cores. |
xmq_host_cpu_cores | gauge | Hardware threads on this machine. |
xmq_host_memory_used_bytes | gauge | Memory in use, excluding reclaimable cache. |
xmq_host_memory_available_bytes | gauge | Memory available to start new work. |
xmq_host_memory_total_bytes | gauge | Physical memory installed. |
xmq_process_cpu_percent | gauge | This process's CPU use, percent of one core. |
xmq_process_resident_memory_bytes | gauge | Resident memory of this process. |
xmq_process_uptime_seconds | gauge | Seconds since this process started. |
Logs
Metrics say that something is wrong; the log says what. The Logging page has aFormat selector, and logging.format inxmq_server.conf does the same. text is the historical line;json writes one object per line, to the log file and to stdout alike:
{"timestamp":"2026-11-09T07:47:57.835+11:00","level":"warning","node":"broker-1","scope":"Startup","message":"The configuration interface is set to plain HTTP."}
{"timestamp":"2026-11-09T07:47:57.847+11:00","level":"error","node":"broker-1","subject":"server_events","message":"No extension authenticates, so only anonymous clients can connect."}| Field | Meaning |
|---|---|
timestamp | ISO 8601 with milliseconds and the local offset. |
level | debug, info, notice, warning, error, critical, alert, emergency. |
node | This node's name. |
subject | The log subject (server_events, publish, connect, ...), when the record has one. |
scope | The component for startup and service records (Startup, Prometheus, ...). |
component | A controller's own name, for records written outside the subject scheme. |
message | The text, with newlines and quotes escaped so the record stays one line. |
The default is text, and text output is byte for byte what it was. A change of format takes effect at the next start, because the engine that writes the lines is built while the server starts; log levels still apply immediately.
Nothing has to be configured in XMQ to collect the lines. A log shipper reads the file or the container's stdout, and the fields become labels. With Grafana Alloy that is a few lines of configuration:
loki.process "xmq" {
  forward_to = [loki.write.local.receiver]
  stage.json {
    expressions = {level = "level", node = "node", subject = "subject", component = "component"}
  }
  stage.labels {
    values = {level = "", node = "", subject = "", component = ""}
  }
}
All four are low-cardinality: the seven priorities, the node names, a dozen subjects and a few components. The message stays in the line, so a query narrows by label first and reads the text after:
{job="xmq", level="error"}
{job="xmq", node="broker-2"} |= "certificate"
sum by (subject) (count_over_time({job="xmq", level="error"}[5m]))
The three select every error on any node, run a text search on one node, and count errors per subject over five minutes. Lines that are not JSON - the entrypoint's own messages before the broker starts - carry no labels and stay readable as they are. The docker/observability stack wires exactly this up: the broker runs with XMQ_LOG_FORMAT=json, Alloy collects its stdout, Loki keeps a week of it, and Grafana provisions an XMQ logs dashboard and an alert on a burst of errors.
What it does not do
- No OpenTelemetry export and no traces. Logs are separate:
logging.format=jsonand a log shipper, not this endpoint. - No TLS and no per-metric filtering. HTTP Basic authentication is available; TLS is expected to be provided by a proxy or a private network.
- No cluster-wide aggregation: each node answers for itself.
- No historical samples. Prometheus is expected to keep them.
Alerts worth having: up == 0 means the exporter or the network is gone, while up == 1 and xmq_up == 0 means the process is alive but MQTT is stopped - the dashboard and the log say why.